 wostrahlung
Radiation in Germany & worldwide – live on the map
Official readings from over 5,000 stations worldwide – updated hourly, with time-lapse and history for every station.
Live
Readings at a glance
Ambient gamma dose rate, 1-hour averageData sources: Bundesamt für Strahlenschutz (ODL monitoring network) and EURDEP, Data licence Germany – attribution – version 2.0; USA: U.S. EPA RadNet (public domain, dose rate converted from nSv/h, updated every 3 hours); Canada: Health Canada FPSN (Open Government Licence – Canada, terrestrial component only); Taiwan: Nuclear Safety Commission (Open Government Data License); citizen network: Safecast (CC0, not official, count rate converted according to tube type – outlined in purple). Short-term peaks after rain are normal (radon washout).
Geiger counters: our recommendations
2 top devices + 1 budget entry modelLinks marked with * are advertisements/affiliate links: if you buy through them, we receive a small commission – the price stays the same for you. As an Amazon Associate we earn from qualifying purchases; we are also a partner of eBay and AliExpress.
Radiacode
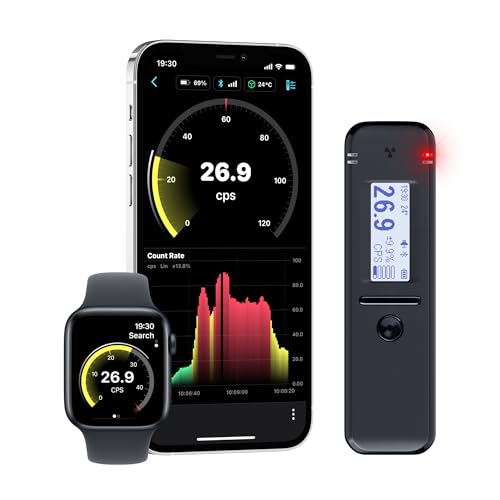
Radiacode 103
Scintillation detector with gamma spectrometer and Bluetooth app: responds much faster and more sensitively than classic Geiger tubes, logs continuously and even identifies nuclides.
approx. €325
Also search on eBay*

GQ
GQ GMC-500+
The proven classic with two tubes for beta, gamma and X-ray radiation: large display, data logger, Wi-Fi connectivity — for years the standard recommendation for demanding beginners.
approx. €109
Also search on eBay*

FNIRSI
FNIRSI GC-01
Compact entry-level device with colour display, rechargeable battery and alarm function: perfectly adequate for home use and first measurements, as long as laboratory precision is not required.
approx. €53
Also search on eBay*
More choice: view all Geiger counters on Amazon*
Also on eBay & AliExpress
branded devices only – no cheap no-name dosimeterseBay Search specifically for branded devices
New and used – the search opens the eBay marketplace for your language. With used devices, check the condition and proof that they work.

FNIRSI · FNIRSI Factory Store
FNIRSI GC-01
The budget entry model straight from the official FNIRSI shop: tube for beta, gamma and X-ray radiation, colour display, rechargeable battery and alarm.

ALIENTEK · ALIENTEK Official Store
ALIENTEK ND1
Compact dosimeter from the well-known measuring equipment manufacturer ALIENTEK: Geiger-Müller tube, dose and dose rate display, adjustable alarm, USB-C.
Putting radiation levels into context
The map shows the ambient gamma dose rate (ODL) in microsieverts per hour (µSv/h). In Germany, natural background radiation is usually between 0.05 and 0.18 µSv/h, depending on geology and altitude – permanently somewhat higher in the granite of the low mountain ranges than in the North German Plain. This is completely normal and no cause for concern.
The same applies worldwide: altitude (more cosmic radiation) and bedrock determine the background level. Values between about 0.03 and 0.3 µSv/h are normal almost everywhere; some regions with naturally radioactive ground are permanently above that.
What matters in an emergency, which equipment makes sense and how to use iodine tablets correctly is explained in our guide:
→ Guide: equipment & the right behaviour
Frequently asked questions
What is the normal radiation level in Germany?
Usually 0.05–0.18 µSv/h depending on the region. In low mountain ranges with granite bedrock, permanently higher values of up to about 0.3 µSv/h are also completely normal.
Why do the readings fluctuate?
Mainly because of the weather: rain and snow wash natural radon decay products out of the air – readings rise briefly by up to 50% and then fall again. Such peaks are harmless.
At what levels does it become a concern?
Only significantly and persistently elevated levels would be a warning sign – in that case the authorities provide information via warning apps (NINA), radio and the BfS channels. For comparison: an intercontinental flight adds about 50–100 µSv of dose.
Do I need my own Geiger counter?
For information alone, the official monitoring network is sufficient. Your own device makes you independent of the internet and power supply, measures at your own location, while travelling or on materials (building materials, ceramics, mushrooms) – and is immediately to hand in an emergency.
Where does the data on this map come from?
From official monitoring networks: the ODL network of the Bundesamt für Strahlenschutz (Federal Office for Radiation Protection, around 1,700 probes), the European data exchange platform EURDEP, the EPA's US RadNet network and the networks of Health Canada and Taiwan's nuclear regulator. In addition, we show the worldwide Safecast citizen network (not official, outlined in purple).
How high is radiation in the USA?
The roughly 115 stations of the US RadNet monitoring network usually show between 0.03 and 0.13 microsieverts per hour – highest in the Rocky Mountains (e.g. Colorado) because of altitude and bedrock, lowest on the coasts.
What does the time-lapse show?
With the player above the map you can play back the hourly readings of the last 24 hours, 3 or 7 days – in an endless loop until you tap Pause or Live. This makes things like rain peaks moving across the country visible.